G.5.1 Analysis biomed fleet
- Click on General data module and click Reporting application
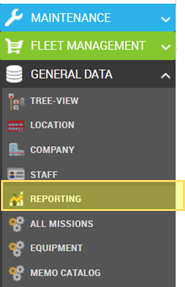
- You can view the topics with reports available. Click on the small arrow next to the topics you which to view
.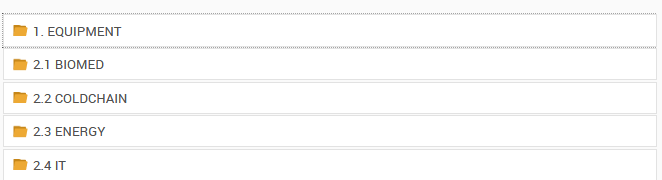
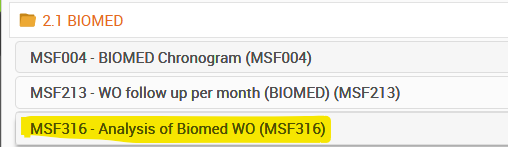
- Reports for each topic will be visible. Click on a specific report to view.
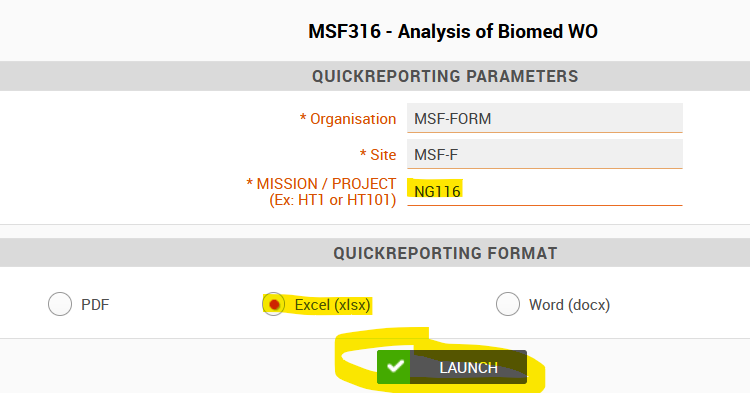
Into ‘MISSION/PROJECT’, enter the mission code (example HT1) to see a report pertaining to a specific mission or the project code (HT133) if you only want to see the data on a specific project.
Note : it isn’t possible to have a report for only 2 projects of one mission at the same time.
- Complete the other information fields required to access the data (example fuel consumption needs the relevant time period)
- Choose file type (excel, PDF…).
- Click LAUNCH to view report.
- Open the Excel file, here is a brief description for each tab:
- Situation: activity over the last 12 months and projection for the next 12 months
- Preventive maintenance: graph knowing if treated on time and the list of WO with a problem
- Corrective maintenance: graph showing the number of maintenance carried out and the list of WO with a problem
- Information of WO: indicators of the correct filling of WO and the list of WO with a problem
- Measurements out of limits: indicators % measurements outside tolerances and not completed as well as a summary by EQ
- Spare parts (consumption): graph of the number of spare parts used per month and a summary by part code of their estimated and actual consumption
- Cost per equipment: summary per equipment of the cost of preventive and corrective maintenance carried out over the last 12 months.
- Intervention time: per technician, the number of biomed BTs / number of all-family WO carried out. As well as number of hours of biomed maintenance / number of hours all families carried out.
- Subcontractors: number of WO processed and intervention costs per subcontractor.