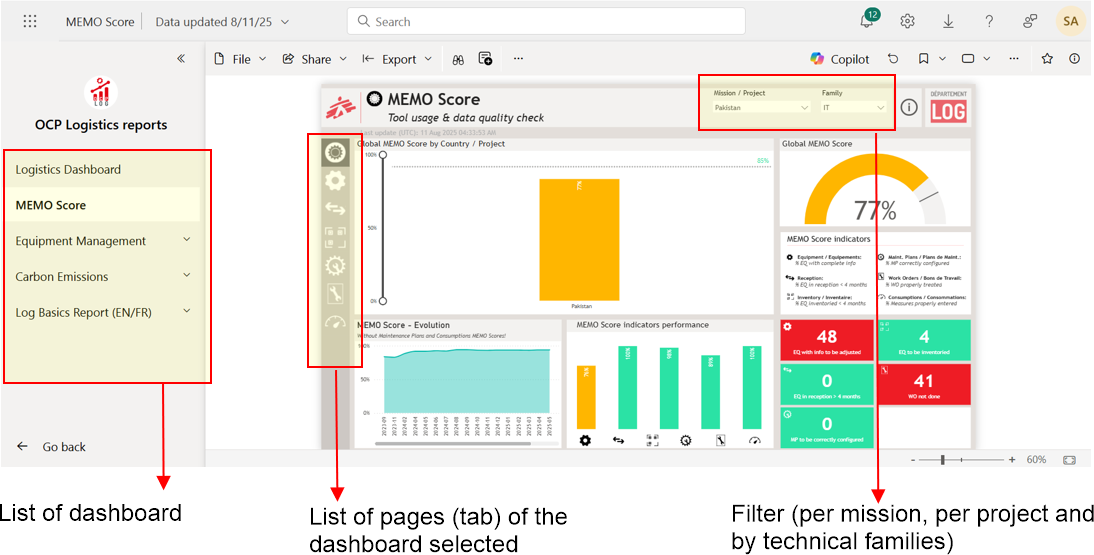
K.3.3 Use the interactive dashboard with PowerBI
You can access to the interactive PowerBI dashboard with this link
The data used for the dashboard are from MEMO and uptaded 1 time a day at 2:00 AM GTM.
The interface of the dashboard :
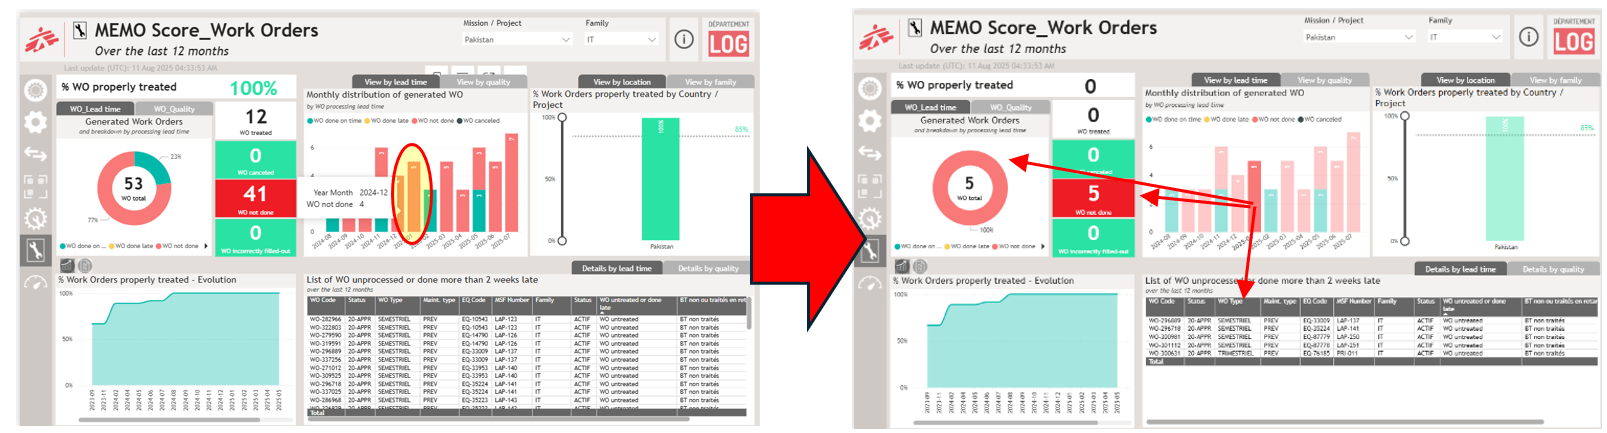
The interactive graphics:
If you select a value in one visual by clicking on it (in this example, by cliking on the January 2025 WO bar) acts like a filter in other visuals, such as table, diagram on the same page.
The different buttons:
 the eraser next to each filter allows you to reset it
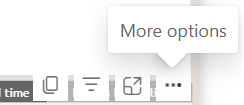
On the table, on the right top corner you have different options:
- You can put the table in full page by using this button

- You can download the table: select more option and select “Export data”
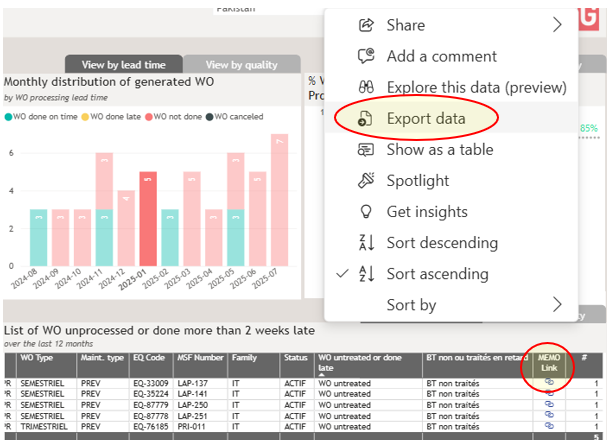
You can also open directly the MEMO page of the equipment or preventive maintenance plan by clicking on the link at the end of each line.
You can copy the graphs to integrate them directly into your SITREP, Annual report, end-of-mission reports, etc. by clicking on the button "copy as image wih caption"